ORB Visualization
(soon)
Tutorial on a small Bead Game Orb
3/16/2004 6:37 PM
In this tutorial we develop a conceptual index into the small glass bead game on
Technological Innovation as an
Evolutionary Process
The collection of textural elements of this bead game is a social discussion between scholars on a complex subject.
The tutorial is available by taking a single file and making a substitution into any of the previous tutorials. For example the tutorial at [one] has the following top folder:
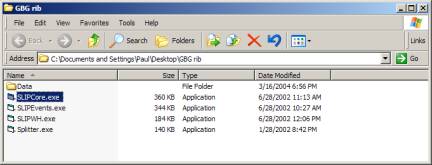
Figure 1: The top folder in the zip file (1.26 Megs – Windows only)
Before removing all of the data in the Data folder, double click on the SLIPCore.exe to produce the screen shown in Figure 2.
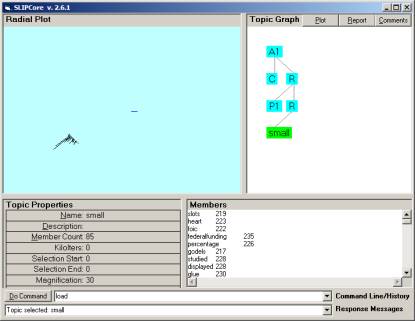
Figure 2: Viewing the data structure in the Data folder
After one double clicks in the SLIPCore.exe, one has to do two things to produce the exact screen in Figure 2. First, type in the word “load” into the Do Command window and a return character. Then click on the blue box with “small” label. The box will turn green and 85 gathered atoms will appear in the Radial Plot window.
Now close the SLIPCore.exe and delete all data in the Data folder.
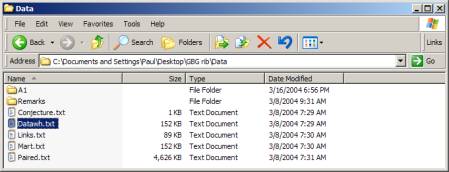
Figure 3: Contents of the Data Folder (before deleting everything)
We will rebuild the data files using only a single Datawh.txt file (104 K file). After downloading this file, put this file into the (now empty) Data folder. Then move back to the .exe in Figure 1. Double click on SLIPWH.exe and enter the following commands
b = 0
a = 1
pull
export
to produce the screen in Figure 4.
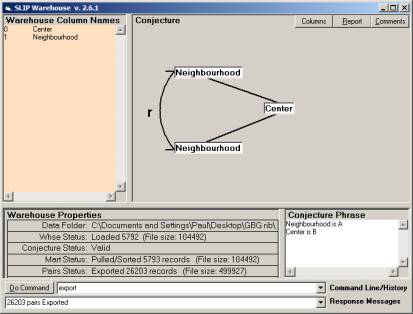
Figure 4: The SLIP Warehouse browser when its work is completed
You can close the warehouse browser, and if you wish look into the data folder to see the new files that are created. In any case, you are ready to double click on the SLIPCore.exe. One needs to issue the following commands:
import
extract
click once (not twice) on the AI box to scatter the atoms to the circle
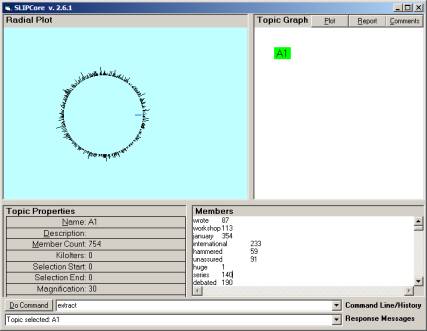
Figure 5: 754 atoms scattered to the circle
One can type in cluster 1000 to perform the gather loop 1,000,000 times (this takes a little under a minute on my computer). Clustering 300,000 times allows one to take out the middle of a distribution in line with the previous tutorials. But for this tutorial we just need to look at all 754 atoms with the subject matter neighborhoods for each of these scattered into a 3-D space (but the local neighborhoods are not connected).
Double click on the Al box to throw the atoms into the eventChemistry browser ( Figure 6)
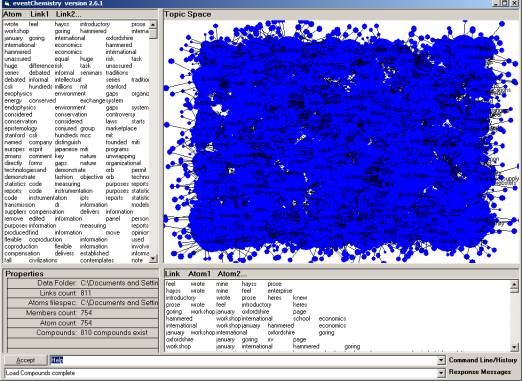
Figure 6: the eventChemistry with the 754 atoms with their neighborhoods
The list on the right side has the atoms and the links related to that atom. Clicking into the blue field will select one of the atoms. Clicking in the list will select one of the atoms or one of the links.
The exact measurement that produces the original data form the bead game can vary. We have only one measurement that is hard wired into the SLIP browser code, and we have locked the code until there is funding to allow the more full expression of general framework theory and n-gram parsing.
In Figure 7 we see the local subject matter indicator for the concept indicated by the words:
{ statistics | measuring, code, reports, purposes }
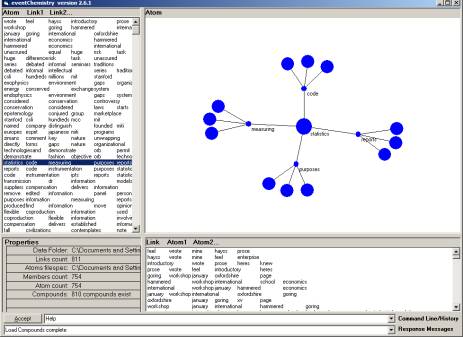
Figure 7: One of the subject matter indicator neighborhoods
Using the software, one can click on the surrounding small nodes (the links) and move the center to the link. Clicking on the link “measuring” produces Figure 8.
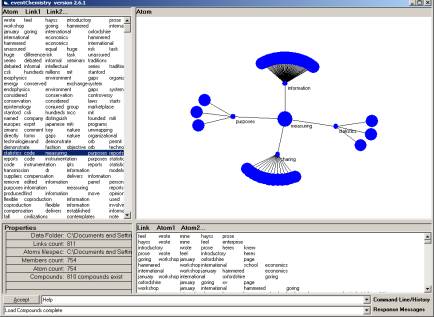
Figure 8: Consequence of clicking the small node in Figure 7 labeled “measuring”