ORB Visualization
(soon)
First bead. This game is dedicated to mapping the progress of Orb technology
3/8/2004 7:34 AM
One reason for having Orbs à Return to the founding
agrarian spirit of America
A tutorial
software download ( GBGrib.zip
with Orb Generator: 1/11/05)
second software download (AllFables.zip
with Orb generator: 1/11/05)
The first parse (March 8th) of the full set of URLs in the bead game produced 8 Megs of data in two columns. These two columns are output to a file called datawh.txt (data warehouse). The bead continued to be developed and there was no archive of just those that existed on March 8th.
Because the file with no stop words is large we used the SLIP splitter to create a random selection of 1/100 of the original datawh.txt file. We know that this new file will create a fractal-like image of what one would expect if one developed results using the original 8 Megs of data.
After creating this random selection, we use the SLIP conjecture to build a set of ordered triples in the form < a , r, b> where a and b are with a distance of one in the full Orb graph (which is never constructed but which exists as a theoretical constraint on the entire process). The “maximal Orb” is an important formal notation from which one developed a Orb arithmetic that is both simple and useful.
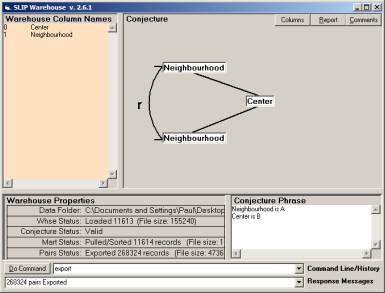
Figure 1: Defining a SLIP conjecture related to the n-gram parse of words
The 8 Meg file is larger than can be used in the SLIP browsers running on my desktop. The software will correct this problem at some point, but for now we have to do with what was developed by Don Mitchell in 2002.
The ratio of original text size to the size of the datawh.txt file is important. As the number of stop words increase, the ratio decreases. Again, these are benchmarking issues, which when fully documented will make these tutorial easier to fully comprehend.
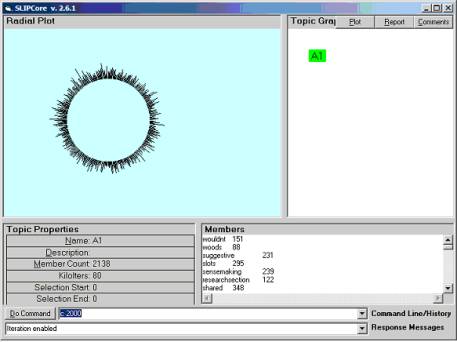
Figure 2: Beginning distribution of atoms derived form 1/100 of the original data
Because of the presence of common words in the datawh.txt file the clustering is expected to quickly draw together into a single (mathematically defined) basin of attraction. We see that this occurs (Figure 3). In a little under a minute the SLIP algorithms perform almost 500,000 iterations of the gather algorithm. This speed is due to the use of an In-memory Referential information base (I-Rib).
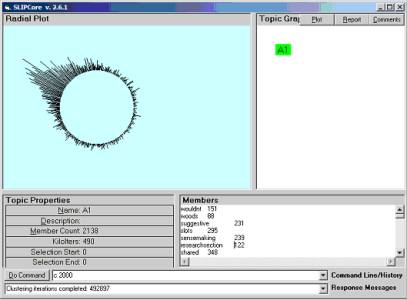
Figure 3: Clustering after 492,897 iterations of the gather algorithm
As we have done in previous work, we know that taking the center out of this distribution and sampling what is left over will produce a high level subject matter indicator map, and that this can be visualize as a small Orb (less then 21K).
This Orb is in fact a proper sub graph of the entire Orb. One is reminded that this projection to a sub-Orb is not the same as the projection of the “Largest Orb” related to the original document collection. Many, but not all, of the computational properties of any Orb projection having roughly the same size is similar.
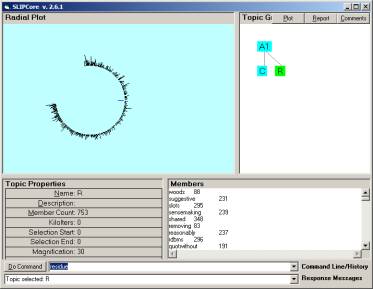
Figure 4: The residue after removing the center of the distribution
The gather iteration is performed 2,000,000 times. There are now 753 atoms as opposed to the 2138 in the gather process pictured in Figure 3. The 2 million iterations take under one minute and produce the stochastic distribution seen in Figure 5.
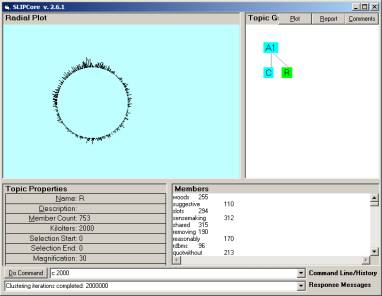
Figure 5: The limiting distribution after 2,000,000 iterations
The number of atoms is still large, 752 terms. However, theory tells us that the clustering we observe here is indicating radically different areas of the social discourse.
Dividing the Orb structure into two parts is show in Figure 6.
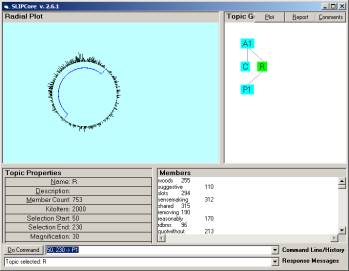
Figure 6: Separating 753 atoms into two groups
The separation creates one group of 288 atoms and one group of 462 atoms. The clustering for the bag of 288 atoms 5,000,000 times requires a few seconds and produces the limiting distribution seen in the next figure. By downloading the free software, one can actually see the clustering occur.
In each iteration, two of these atoms are selected at random. The question is (algorithmically) asked regarding if there is a relationship of co-occurrence between these two randomly selected words. Doing this using I-Ribs allows an algorithmic loop to occur millions of times in seconds. (call Dr. Prueitt 703-981-2676 if you have question regarding this.) Each loop gathers two points on the circle and moves them a little closer together or not depending on if there is a relationship indicated in the referential base.
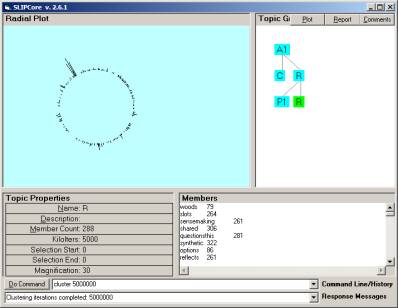
Figure 7: A limiting distribution for 288 atoms
In Figure 7 we can see a gathering of what appears to be 80 or so atoms at the position of about 105 degrees. Since it only takes a few second to recluster this Orb construction, we randomize and re-gather to produce a self-similar (fractal) mirror where the clusters in Figure 7 are distributed differently that in Figure 8.
An inspection of the cluster at 270 degrees in Figure 7 will show that this cluster is exactly the same as the cluster at 90 degrees in Figure 8. This observation is addressed formally in the SLIP theorems.
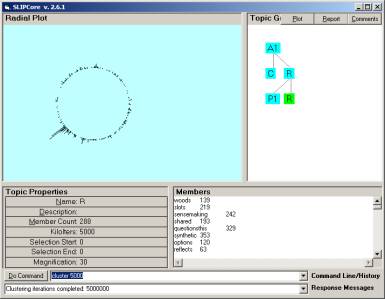
Figure 8: A fractal mirror of Figure 7
An moments reflection will show that the generic Orb cannot be viewed in any dimension that can be rendered in 3-D computer graphics. However, the foundational SLIP theorems suggest that for a specific Orb there is a minimal dimension and topological type.
The theorems on the minimal dimension in which an Orb can be visualized without topological distortion has not yet been written out, but there is a categorical argument that starts out, suppose this is not true.
The SLIPCore browser is equipped to throw the local subject indicators (topological neighborhoods of the Orb graph) into a three dimensional space and to allow visualization and navigation of the local subject matter indicators neighborhoods.
This practical solution, to the “visualization problem”, lead to our notion of a subject matter indicator neighborhood, and to our provisional patent.
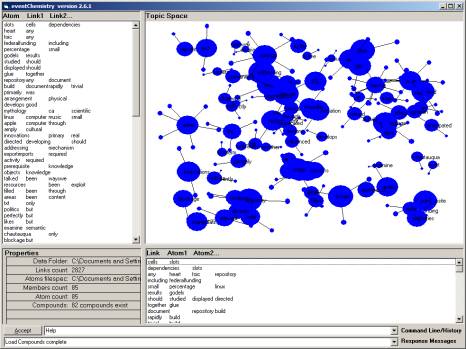
Figure 9: eventChemistry browser with 85 atoms from figure 8
The software to demonstrate the material above is made freely available from a simple download of a Visual Basic .exe that was coded by Don Mitchell and Paul Prueitt.
One of the subject matter indicator neighborhoods is shown in Figure 10.
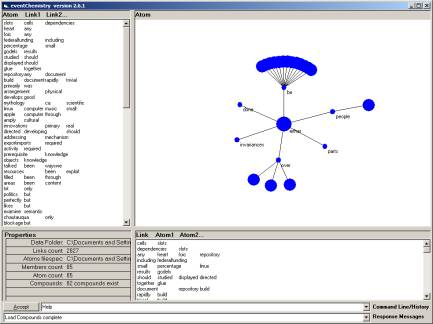
Figure 10: The subject matter indicator neighborhood for the word “either”
If you do download the software and would like some help working through the tutorial then please give Dr. Prueitt a call at 703-981-2676.